
Last Modified on March 19, 2025
If websites are like shops, then landing pages are the displays that shoppers see first. Just like a store window influences when someone walks in or keeps moving, a landing page can influence whether visitors engage with your brand or bounce away.
Why? Because it’s the first page a user sees when they visit your website, and it could be their last visit to your site if they don’t like it for whatever reason.
If that’s not enough, digital marketers often spend a lot of money to bring visitors to different landing pages through ad campaigns and SEO efforts.
This makes it quite important to understand what users are doing on these pages and how you can measure the performance of these landing pages so you can get the most out of them.
So, in this post, we’ll discuss the top 10 landing page metrics you need to track, regardless of the landing page analytics tool you’re using.
- Traffic Sources
- Conversion Rate
- Bounce Rate
- Average Time on Page
- Form Abandonment Rate
- Cost Per Conversion
- Exit Rate
- Scroll Depth
- Click-through-rate (CTR)
- New vs Returning Visitors
Let’s dive in!
1. Traffic Sources
Your traffic sources aren’t a metric but before we get into the details about metrics and how we can use them, it’s important to talk about traffic sources.
When you’re tracking different metrics for landing pages, looking at the traffic sources gives you a lot of information about how those different sources are performing for your landing page(s).
For instance, if Paid Search isn’t doing as well on [insert metric here] but you’re spending a lot of money compared to Paid Social, then it gives you the insight to divert your budget and efforts to Paid Social.
At the same time, it signifies that there’s some issue with your Paid Search campaigns so you can look into them and see how they can be optimized.
This is, of course, a simple example but when you use traffic sources to look at different metrics, you find insights that are quite helpful.
2. Conversion Rate
The goal of the landing page is to play a significant role in converting users, i.e., making it easier for users to take the desired action such as submitting a form, making a purchase, etc.
Conversion rate aka CR measures that by using the following formula:
Total Conversions / Total Visitors * 100
This could be for any specific conversion event or for all the conversion events that can happen through or on a landing page.
Knowing what landing pages convert better than others can help you decide where to put your budget and/or efforts.
You can also dive deeper and find out what could have caused some landing pages to perform better than others, e.g., is it due to traffic source, device type, messaging, visuals, etc.
It’s also a good idea to look at your industry’s average conversion rate and try to benchmark against that.
But know that your conversion rate can vary due to nuances specific to your business, even due to where your business is located among many other factors.
You could also look at the conversion rate for new and returning visitors by replacing the total visitors with new or return visitors in the formula above.
For instance, let’s say that you want to understand how first-timers convert. Again, this could vary if your product/service has a high price tag and users have to think (or shop around) before making a decision.
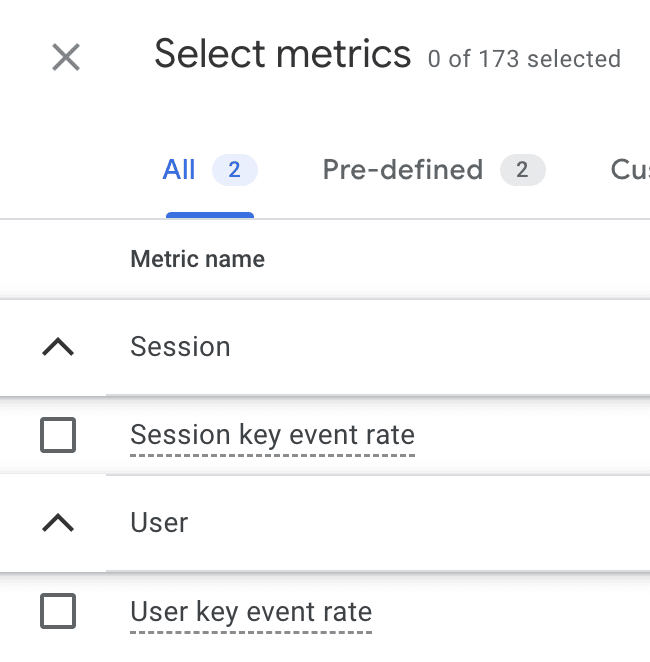
If you’re using GA4 as your go-to analytics tool then you can find session and user conversion aka key event rates there.
3. Bounce Rate
As we’ve talked about it, so let’s explore it further. Bounce rate helps to understand engagement (or lack thereof).
The bounce rate is simply the percentage of people who enter and leave from the same page in a session without interacting. It’s calculated with the following formula:
Sessions with one page / Total Sessions * 100
You can also use it to find any issues, e.g., pages with a 100% or 0% bounce rate with min. of 100 sessions indicate there’s some underlying issue with your landing page(s).
But most importantly, you want to find the landing pages where users bounce too soon because it helps to understand things like:
- Relevance: Is the content not relevant to them based on their traffic source? Or maybe the ads are not targeting relevant people.
- Design/functionality issues: Visitors finding it hard to find things they are looking for or CTAs not working as expected.
- Lack of clarity: Is the messaging too technical or is not answering their questions?
These are just a few examples, but they open up a conversation to optimize user experience. The goal is to have as low a bounce rate as possible.
If you look at the industry average, then according to Hubspot it should be somewhere between 26% and 70%.
Understandably, this will vary depending on the industry, business model ( B2C, B2B), device type, and even the page type. For instance, for blog pages, the bounce rate is often quite high, around 65%.
So, it’s important to keep that in mind. If it is likely that you have bounce rates lower than 20%, you might want to look into your tracking if that’s what you’re seeing.
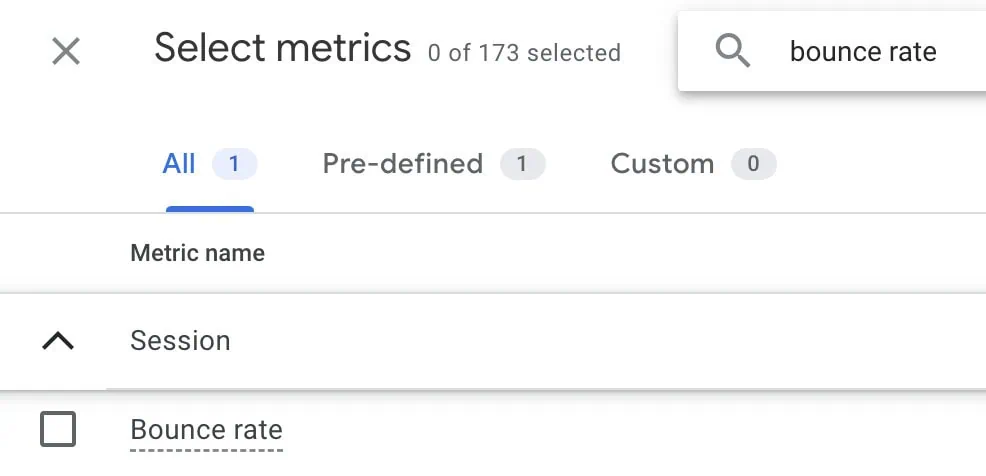
If you’re having difficulty finding it in GA4 then you always go to explorations as most metrics are available there.
4. Average Time on Page
This metric helps to understand how long visitors are staying on the landing page. This metric can be good or bad depending on the type of your business and/or the landing page.
For instance, if your business sells high-value products/services, then people would spend a long time trying to understand the value they are getting.
Alternatively, if the page is more about educating the visitors with long-form content, you’d expect them to spend more time.
In these cases, if visitors are spending very little time, this would indicate that there’s some issue like they don’t find the content interesting, the layout is confusing, or the content is just overwhelming.
If your landing page is short and simple with a few form fields, then the average time would be low.
If it’s high, then users are possibly struggling to find the info they are looking for or maybe the CTAs or forms aren’t working fine.
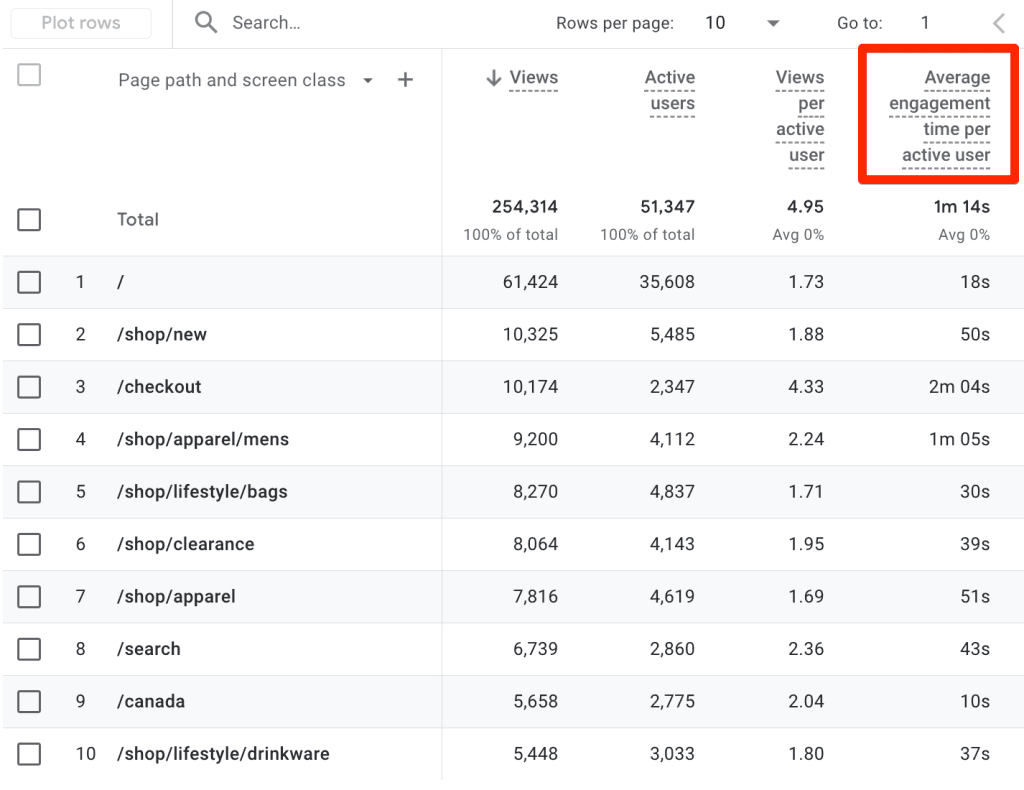
So, it’s important when you’re using this metric that you’re aware of these nuances. If you’re using GA4, then you can use the Average Engagement Time available in the tool.
5. Form Abandonment Rate
This rate is relevant for landing pages that have forms and can help you understand if users find the forms too long, or confusing, or if there are any other friction points when they are filling the form.
Understanding these things can help you optimize the forms and/or user experience so you can get more users to complete the forms.
It’s calculated with the following formula:
Form started (Users) – Form completions (Users) / Form started (Users) * 100
For instance, 600 users started the form but 240 completed it. We’ll calculate the abandonment rate as follows:
600 – 240 / 600 * 100 = 60%
So, 60% of users abandoned the form. You can also calculate it another way:
1 – Form completion rate
Completion rate = Form completions (240) / Form started (600) * 100 = 40%
Abandonment rate = 1 – 40% = 60%
Use whatever formula you wish, as long as you get the correct data, you’re good to go. If you use any forms-specific analytics tools, then this metric should be available.
However, if you’re using tools like GA4, then you can add a custom metric to calculate the abandonment and analyze your landing page performance, provided you already have form tracking in place.
6. Cost Per Conversion
Quite often landing pages get traffic through paid marketing efforts, i.e., search ads, paid ads, display ads, influencers, etc.
Now, if you’re spending a good amount of money to bring in traffic and to convert users, then you’d want to keep an eye on the costs, specifically how much each conversion is costing you.
This would help you understand if your landing page is costing you too much to get conversions or even achieve industry specific conversion rates.
You can calculate cost per conversion with the following formula:
Marketing cost ($) / Conversions
So, if you’re spending $2,500 and get 121 conversions then your cost per conversion will be:
$2500 / 121 = $20.67
Ideally, your cost per conversion should be lower than the value of the conversion. Otherwise, you’re not getting a lot of benefits.
7. Exit Rate
You might be wondering – isn’t it the same as the bounce rate? Well, you’re not completely wrong there as they can be confusing, but there’s still some important difference between the both.
The bounce rate focuses on single-page sessions where the user enters and exists after interacting with just one page. Whereas the exit rate focuses on sessions that end after the user interacts with multiple pages.
This means that a page that had a bounce will be counted as an exit, but a bounce won’t be counted if an exit happens after two or more pages.
The exit rate can be calculated with the following formula for the same page:
Number of Exits / Total Pageviews * 100
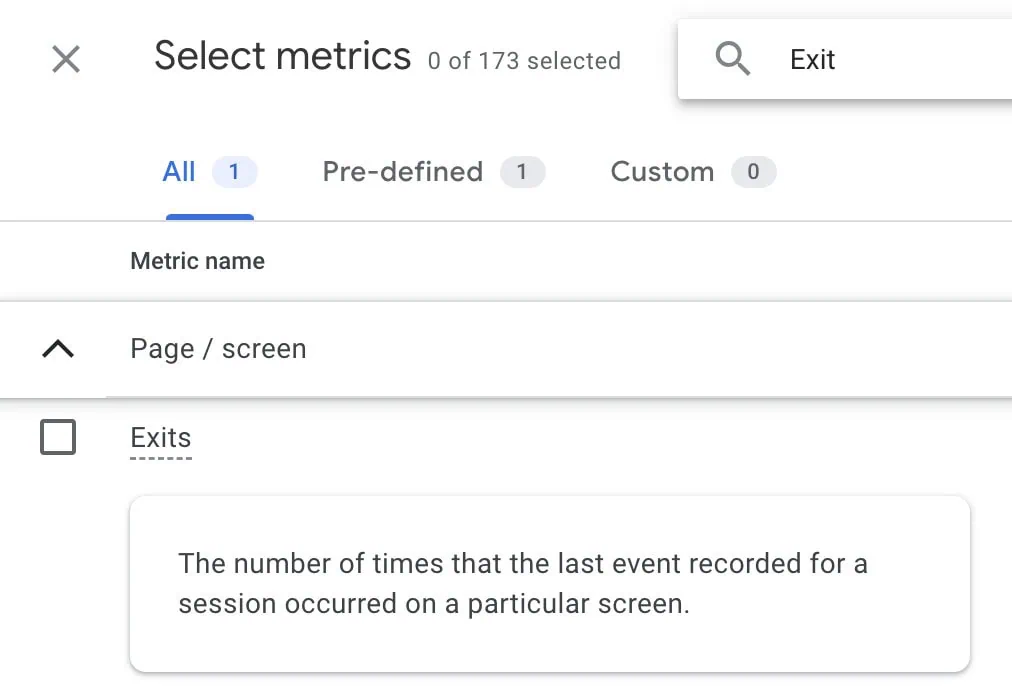
This metric was readily available in Universal Analytics. But in GA4, you can only find ‘exits’ as a metric. However, if you’d like to calculate the rate you can create a custom metric.
If you don’t want to take that route, then you can calculate it in external tools like Sheets or Looker Studio.
When analyzing the exit rate for landing pages, you should pay attention to high exit rates right away if you want the visitors to take action on the same page.
But if the landing page is supposed to guide users to other pages, then you want to calculate it for the final page where the visitors can take desired actions.
So, this is to see if the landing page is doing a good job guiding visitors. However, you cannot blame the landing page entirely for any shortcomings as there are other pages in the mix as well.
So you’d have to look at all the pages in the flow to see how relevant they are for the visitors when it comes to taking the desired actions.
If you’re interested in learning more, you should check our post on What are Exit Pages (+Examples).
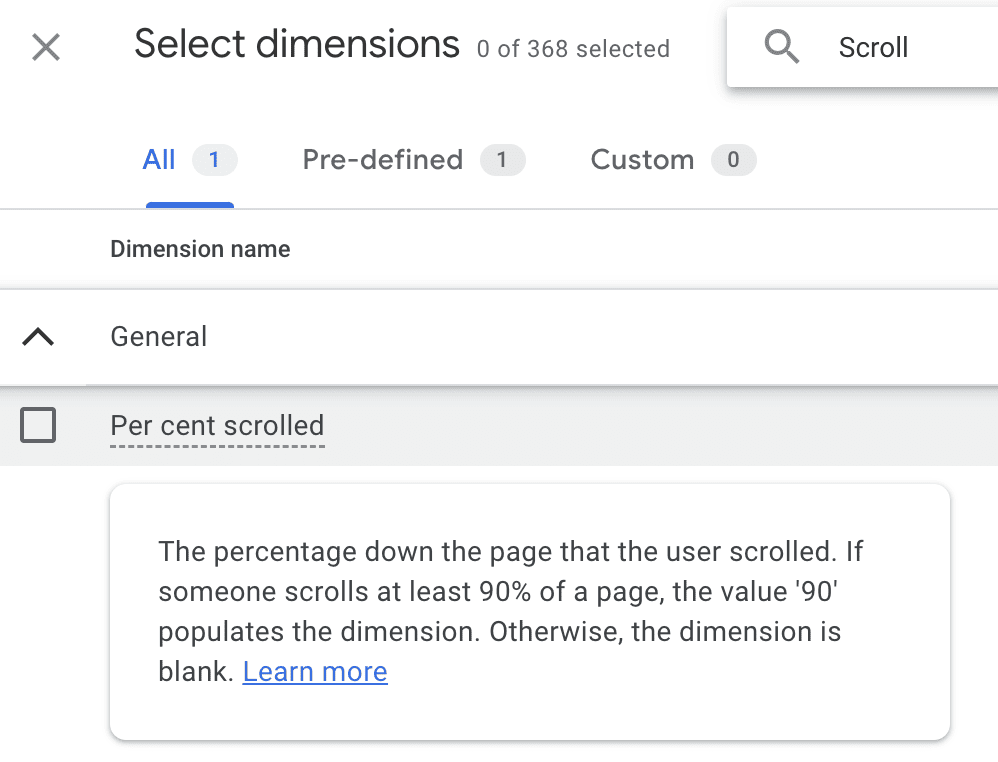
8. Scroll Depth
This is a well-known metric that generally looks at how deep down the page visitors are scrolling and generally refers to vertical scrolling. Scroll depth is typically expressed in percentage, i.e., 10%, 25%, 50%, 75%, or 100%.
It’s quite rare for landing pages to have horizontal scrolling. But you could have elements like comparison tables, you’d want to know if users scroll until the end or not.
This engagement metric can be helpful, especially if you have important elements like CTAs, security badges, social proof, or any important messages, and you want to find out if visitors are scrolling deep enough to see them.
The idea is to place these elements where visitors can quickly see and interact with them, and more so if they are important.
It’s mostly relevant if you have a landing page with a lot of content and visitors have to scroll to consume it.
In GA4, it’s available as a dimension since it represents different categorical values rather than a continuous numerical measurement.
9. Click-through-rate (CTR)
CTR is generally calculated for elements like buttons, links, etc. that visitors can click through to another page or open a modal/pop-up.
The formula for CTR is as follows:
Total Clicks / Total Impressions * 100
Impressions generally refer to the number of times an element is shown to visitors. So, if your CTA was visible 2,340 times and received 147 clicks, the CTR will be:
CTR = 107 / 2340 * 100 = 4.55%
You should be tracking this metric if your landing page is directing users to other pages after clicking through any buttons or links.
A high CTR would indicate that your copy, design, and CTAs are doing a good job of encouraging users to click.
On the other hand, low CTR signals that the users don’t find the copy relevant, don’t have trust due to the design of the page or the CTAs aren’t compelling enough.
A sudden dip in CTR could also suggest that the buttons or links aren’t working properly.
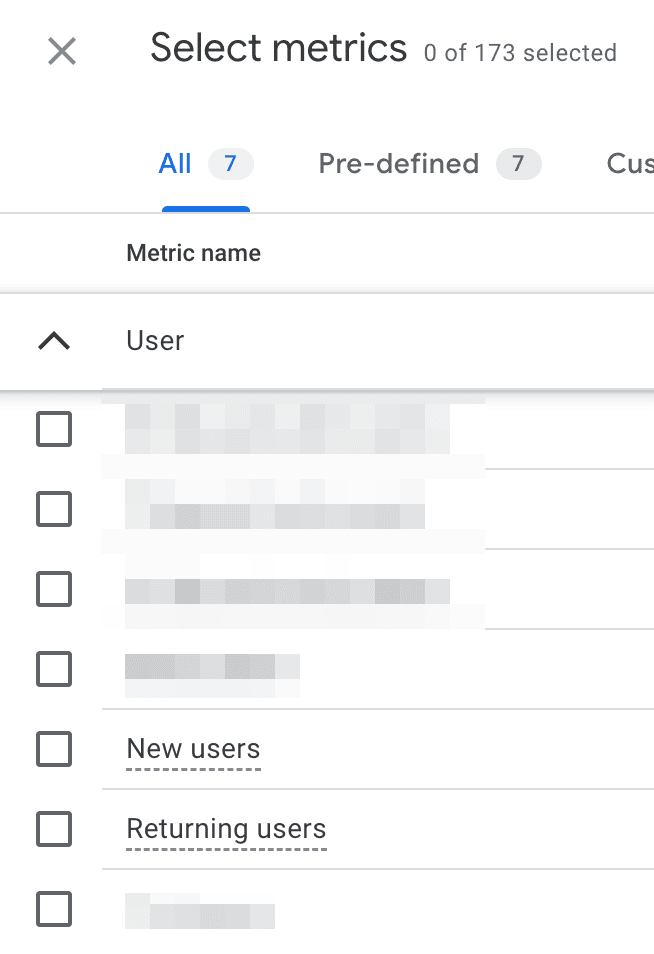
10. New vs Returning Visitors
It can be helpful to look at new and returning visitors. But on their own, they might not explain a lot, so you might want to analyze the behavior of these visitors combined with other metrics such as conversion rate, bounce rate, etc.
For instance, if the bounce rate for new visitors is too high, then it signals something is wrong or unclear that is causing them to quickly leave.
If the bounce rate for return users is lower, then it would be a good idea to understand why that’s the case.
Could it be that they found what they were looking for in the second visit? Did they scroll down further to find it? See, we are pairing it with another metric here as well.
Further qualitative analysis with the help of a scroll map, a heat map, and/or session recordings would help to find the ‘whys’ behind the ‘whats’ you see, so you can take some action.
Both metrics are available in GA4.
Summary
In this post, we covered the top 10 metrics that we can track for the landing page. However, some of them depend on the type of your landing page and your industry.
These aren’t the only metrics you’d want to track, as there could be others that are more niche/ specific to your business.
Some of these metrics can help to understand engagement, while others look at conversion-related actions.
It really boils down to the goal of your landing page in the end, and discussing it with the wider marketing team would help you nail it down even further.
But perhaps the most important one and it’s not really a metric, is the traffic sources, as you can use it for different metrics to find out how a traffic source performs against a certain metric. This helps better with optimization than just looking at metrics stand-alone.
You can take it a few steps further by pairing these metrics with data from behavioral web analytics tools like Hotjar, Clarity, etc. to view the heatmaps and session recordings, which can give you a lot more context than just looking at the numbers.
You can even take a step further with things like user testing, custom interviews, and exit intent surveys to see where visitors hesitate to take the desired action.
If you want to improve user experience on your landing pages, check out our guide to using analytics to improve UX.
So, what metrics do you track for your landing pages? How does it help you to measure and optimize the landing pages? Let us know in the comments below!


")