
It’s not always clear whether your audience is truly engaged or just passing through.
Customer engagement analytics helps you figure out who’s sticking around and what’s driving customers to take action.
When businesses pay attention to these insights, they can keep customers coming back, and, in the long run, turn more interactions into conversions.
We’ll break down exactly how engagement analytics work and how to use them to build stronger connections.
- What Is Customer Engagement Analytics?
- Why Is Customer Engagement Analytics Important?
- Best Practices for Customer Engagement Analytics
- Key Customer Engagement Metrics to Track
Let’s dive in!
What Is Customer Engagement Analytics?
Customer engagement analytics involves collecting, tracking, and interpreting data on how customers interact with a brand, product, or service.
These interactions can occur across multiple touchpoints, including websites, apps, social media, and offline channels.
Engagement includes any form of interaction before a conversion, such as viewing a page, watching a video, or clicking a button.
While customer engagement analytics applies to online and offline environments, this discussion focuses on its role in digital marketing. In this context, customer engagement analytics can be divided into four main categories:
- Website & App Analytics (including organic efforts and eCommerce tracking)
- Social Media Analytics
- Paid Ads Analytics
- Email & Messaging Analytics
Why Is Customer Engagement Analytics Important?
Customer engagement analytics is essential for measuring how well audiences connect with your solutions. Higher engagement increases the likelihood of conversions, whether purchasing, signing up for a newsletter, or another desired action.
Engagement sits between the top and bottom of the marketing funnel, helping businesses understand the transition from initial interaction to retention and conversion.
By analyzing engagement metrics, companies can identify friction points in the user journey that hinder conversions.
When these metrics improve, prospects and existing customers are more likely to stay engaged and move toward committed actions, such as registrations, purchases, or other meaningful interactions.
Without engagement, there is no sustainable growth. Unless your brand is exceptionally compelling, most users take time before taking action. They may visit, leave, and return multiple times.
Engagement aims to ensure they interact with your brand frequently, building familiarity, trust, and affinity, ultimately leading to better retention and higher conversion rates.
Best Practices for Customer Engagement Analytics
Although engagement metrics come pre-built in most analytics tools, engagement remains a flexible concept. Decision-makers define what constitutes engagement based on business objectives.
For example, a tool might offer a default metric such as Average Engagement Time. But should 10 seconds or 30 seconds be considered meaningful engagement?
Moreover, some engagement metrics are unavailable out of the box (e.g., tracking points earned in a game) and require custom configurations within analytics tools.
Since engagement analytics track interactions preceding purchases, they are directly tied to conversion rates.
Understanding these interactions and their relationship with macro conversions helps businesses pinpoint bottlenecks and optimize user journeys.
Key Steps for Implementing Customer Engagement Analytics
1. Determine Analysis Needs
Start by consulting various stakeholders, including clients and internal teams, to identify which engagement metrics are necessary and assess any challenges in tracking them.
Engagement varies across departments.
For example:
- An SEO or content marketer may define engagement as users scrolling past 50% of a page.
- An eCommerce manager may focus on how often a product is viewed.
Stakeholders may also be unaware of all the tracking options available. Educating them on potential engagement metrics ensures a more comprehensive analysis.
Before customizing, start with default engagement metrics available in analytics tools. Some key metrics (covered in detail later) include:
- Page Views
- Sessions
- Engagement Time
- Pages per Session
- Likes
- Comments
- Shares
- Clicks
- Click-Through Rate (CTR)
- Open Rate
- Product Views
- Item Clicks
- Items Selected
2. In-Built Customer Engagement Analytics
Most analytics tools provide standard engagement metrics by default. However, these may not always be sufficient.
Critical interactions, such as button clicks, sometimes require additional tracking configurations.
3. Create an Implementation Guide
Once key engagement metrics are identified, best practice dictates the creation of an Implementation Guide.
This document provides clear, step-by-step instructions for implementation teams (web analysts, digital marketers, developers) on how to track and measure engagement effectively.
Key Customer Engagement Metrics to Track
🚨Note: Conversions are not included in this list of engagement metrics. While conversions represent a deep level of engagement, they are more closely associated with decisive actions at the bottom of the funnel. Engagement metrics, on the other hand, typically reflect mid-funnel activities.
The following engagement metrics are categorized based on different digital channels:
- Web & App Engagement Metrics
- Social Media Engagement Metrics
- Paid Ads Engagement Metrics
- Email & Messaging Engagement Metrics
Metrics marked with an asterisk (*) are specific to Google Analytics. They may not be available on other platforms.
1. Website & App Engagement Metrics
Page Views
Page views track the number of times a webpage, landing page, or website is accessed. This foundational metric helps determine whether users are reaching your content.
However, page views alone do not indicate engagement depth; additional metrics like time spent on a page offer more insight.
Sessions
A session represents a period of active engagement with a website or app.
Different analytics tools define sessions differently, but Google Analytics 4 (GA4) typically sets a session as 30 minutes of user activity.
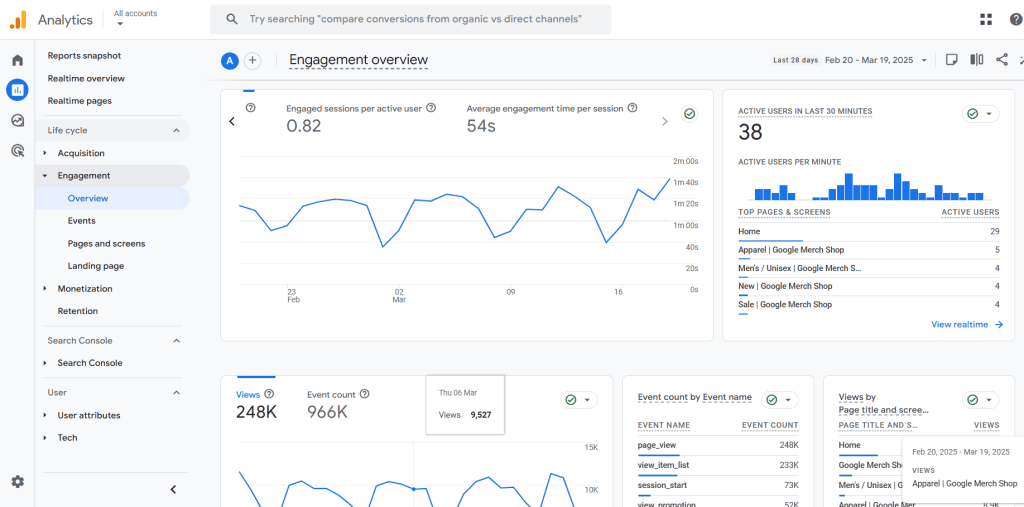
Engagement Time
Engagement time measures how long users interact with content. In GA4, this metric includes:
- Average Engagement Time: The average time an app remains in the foreground or a website stays active in a browser.
- Average Engagement Time per Session
- Average Engagement Time per Active User*
You can find these in GA4 under Reports → Engagement → Overview.
💡Pro tip: These metrics can be applied in more specific contexts. For example, within the GA4 Engagement section, you can review the Pages and Screens report to see how long users spend on a particular page. This allows you to compare content performance more effectively.
Pages per Session
This metric measures how many pages a user visits within a session.
While a session indicates general engagement, pages per session provide insight into whether users are actively exploring your website.
A good engagement benchmark is at least two pages per session, with three pages per session being a strong indicator of engagement.
Engaged Sessions*
GA4 defines engaged sessions as those that meet at least one of the following criteria:
- Lasts 10 seconds or longer
- Has one or more conversion events
- Includes two or more page views
Engaged sessions provide a clearer picture of actual user activity than total sessions.
2. Social Media Engagement Metrics
A well-rounded digital marketing strategy includes social media engagement. Key metrics include:
- Likes
- Comments
- Shares
- Clicks
🚨Note: Similar to web analytics, macro actions (e.g., number of subscribers) are not included in engagement tracking since they represent a final commitment rather than ongoing engagement.
3. Paid Ads & Email Engagement Metrics
Facebook engagement report
🚨The engagement report above was created just to showcase some engagement metrics. Sometimes, the names and calculations differ. For example, CTR (All) in Facebook/Meta includes a mix of click types, such as comments, shares, likes, and others combined.
Click-Through Rate (CTR)
CTR measures the percentage of users who click a link after seeing an ad, search result, email, or social media post.
Higher CTR indicates stronger engagement. Benchmarks vary, but generally:
- A good CTR for paid ads is above 2%, with 5%+ considered excellent.
- For SEO, CTR tracks how often users click on a search result.
- For email marketing, CTR measures how many recipients click links after opening an email.
Open Rate
Open rate refers to the percentage of recipients who open an email or SMS.
While it doesn’t guarantee conversions, it indicates whether the subject line and preview text successfully captured attention.
4. Product Engagement Metrics
For eCommerce and digital products, engagement tracking focuses on interactions before users add items to their cart or complete a purchase. Key metrics include:
- Product Views: Number of times an item is viewed
- Item Clicks: Number of times users click on a product
- Promotion Views: Number of times users view a promotional offer
- Promotion Clicks: Number of times users engage with a promotion
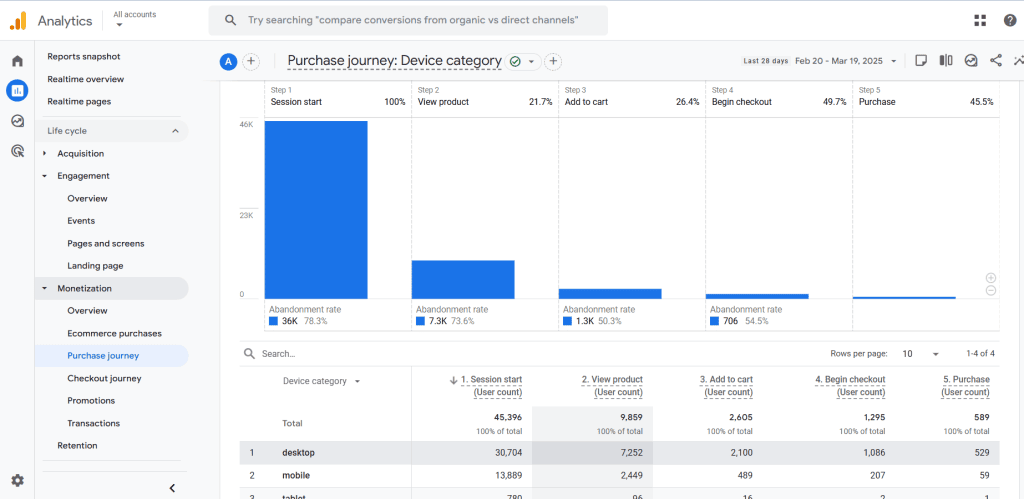
Here’s an example of a promotion funnel:

If a conversion funnel presents issues, analyzing preceding engagement metrics helps identify where users drop off and optimize accordingly.
Summary
Customer engagement analytics provides valuable insights into user behavior before conversions occur.
By tracking key engagement metrics across different channels, businesses can refine their strategies, improve retention, and both drive and sustain conversions.
However, understanding your customers’ deepest motivations is essential for long-term success, and How to Collect and Utilize Customer Insights and Analytics explores this in depth.
How do you measure customer engagement? We’d be interested to know.


")